
Menu Metrics Every Restaurant Owner Should Track
Menu metrics help restaurant owners track sales, costs, profitability, waste, and channel performance to make smarter, more profitable menu decisions.
menu development
May 12, 2026
Menu metrics help restaurant owners track sales, costs, profitability, waste, and channel performance to make smarter, more profitable menu decisions.
May 12, 2026
A Cloud Kitchen helps restaurateurs serve delivery customers, reduce front-of-house costs, manage digital orders, and grow profitably with data-driven operations.
May 11, 2026
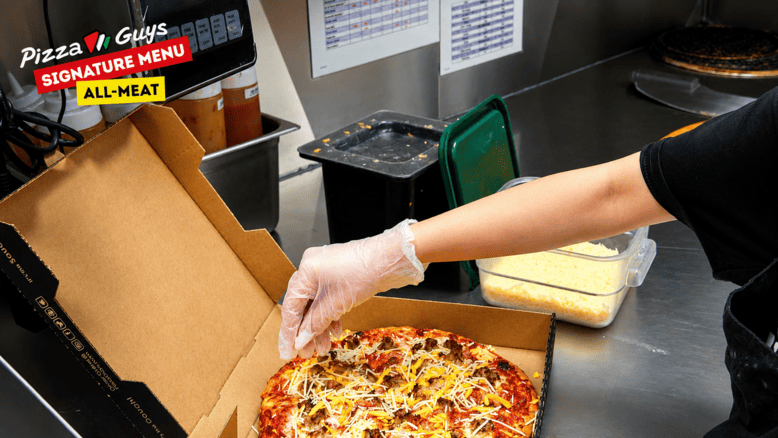
Discover the real challenges and rewards of opening a pizza restaurant franchise in Huntington Beach, California. This article explores the operational journey, family dynamics, and strategic choices behind Pizza Guys, through the lens of the owner’s experience.
May 12, 2026

Explore the best areas in Virginia to open a restaurant by comparing demand, costs, tourism, labor, competition, and concept fit.
May 8, 2026
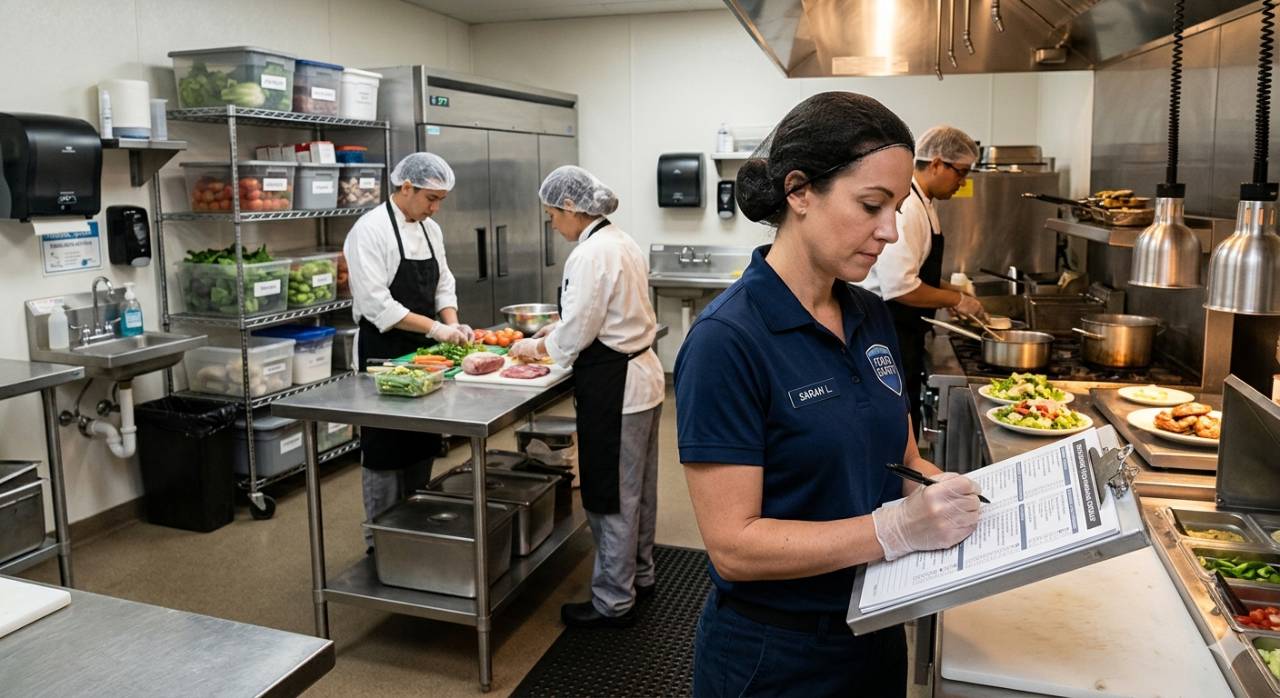
Food handling checklists help restaurants manage receiving, storage, prep, cooking, service, cleaning, training, and daily safety checks.
May 8, 2026

Learn how ignoring employee availability and scheduling preferences leads to disengagement, higher turnover, and lower productivity. Discover why people-focused scheduling improves retention, morale, and overall team performance.
May 8, 2026

Optimize your restaurant google business profile with accurate details, posts, Q&A, attributes, reviews, and tracking to increase visibility and orders.
May 6, 2026
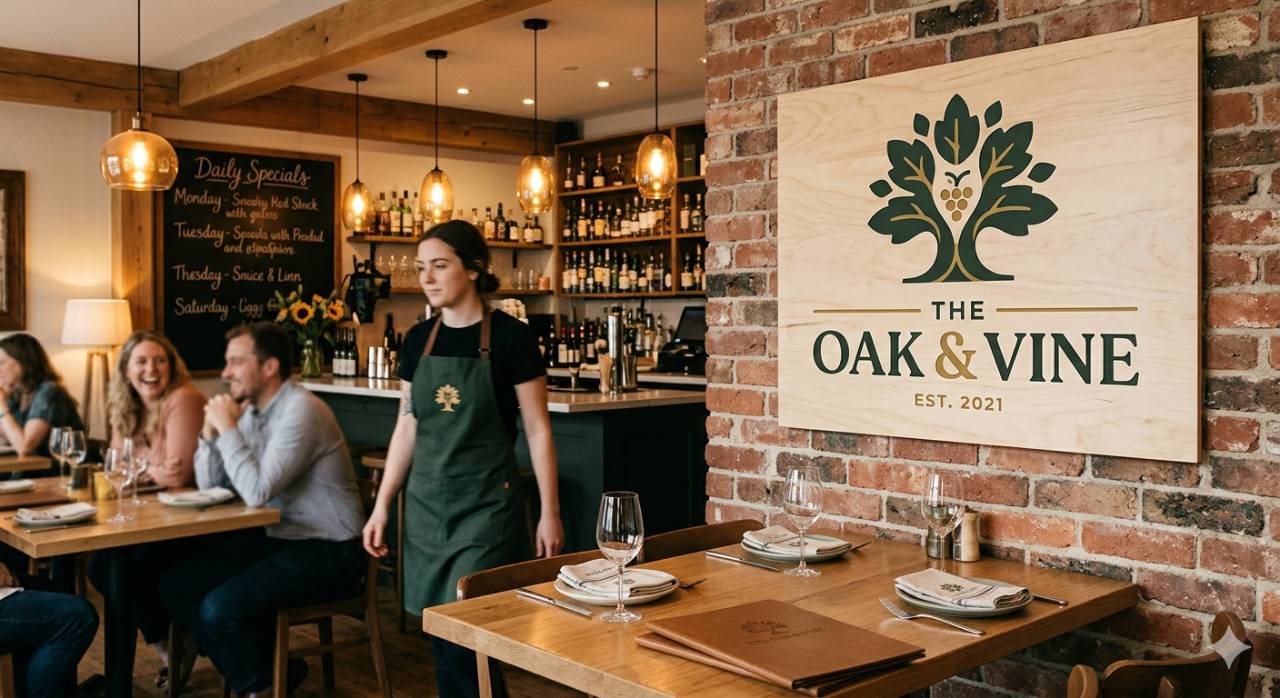
A strong restaurant brand comes from clear values, consistent experiences, visual identity, customer focus, digital presence, and trusted service.
May 5, 2026

Discover how constant last-minute schedule changes create workplace stress, lower employee morale, and reduce productivity. Learn why structured scheduling improves retention, communication, and overall business efficiency.
May 7, 2026

Clopen shifts may seem efficient, but they reduce rest, increase fatigue, and harm employee performance. Learn how back-to-back shifts impact morale, productivity, and retention and how better scheduling can improve team well-being and business outcomes.
May 6, 2026
Menu metrics help restaurant owners track sales, costs, profitability, waste, and channel performance to make smarter, more profitable menu decisions.
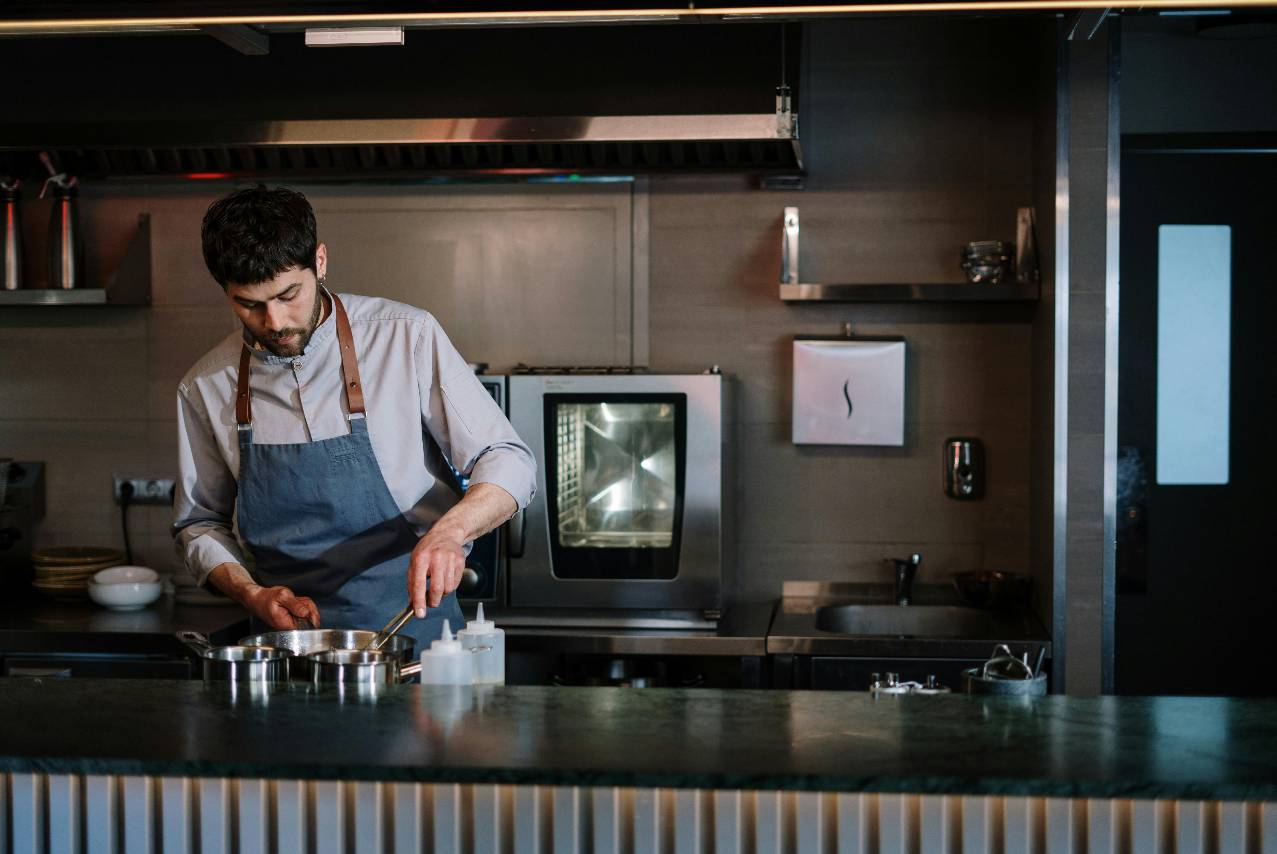
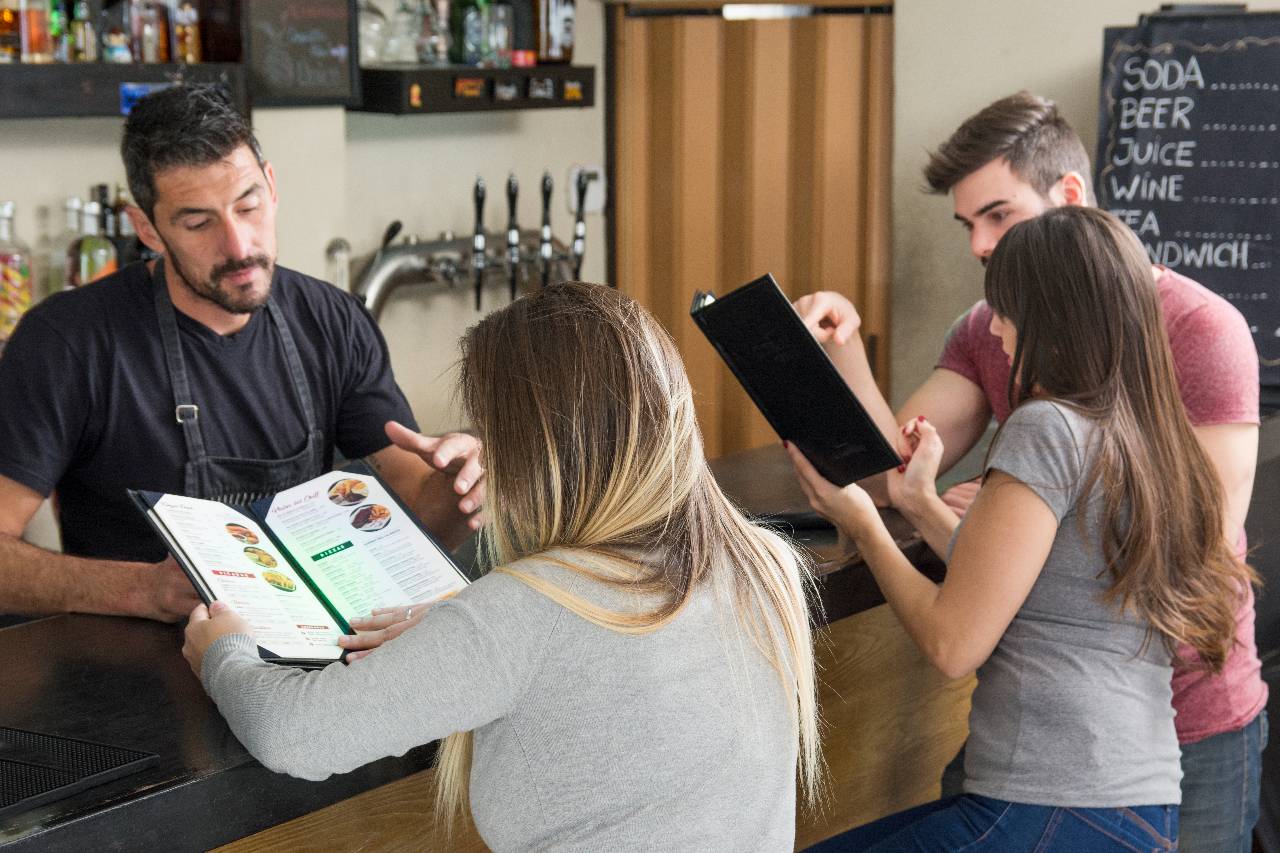
A menu is a financial tool that affects food cost, labor, prep time, waste, inventory, pricing, kitchen speed, and customer satisfaction. When restaurant owners do not track menu performance, they may make decisions based on habit, opinion, or personal preference instead of real data.
Sales numbers are important, but they do not tell the full story. A menu item may sell often, but if it uses expensive ingredients, requires too much prep, creates waste, or slows down service, it may produce weaker profit than expected. At the same time, an item with lower sales may still be valuable if it has a strong contribution margin, uses shared ingredients, or encourages customers to add sides, drinks, or upgrades.
Tracking menu metrics gives owners a clearer view of what is working and what needs attention. It helps identify which items should be promoted, repriced, simplified, improved, or removed. It also connects menu decisions to inventory control, labor planning, food waste, and cash flow. With the right menu metrics, restaurant owners can make smarter decisions that protect margins and improve long-term profitability.
Sales volume is one of the first menu metrics every restaurant owner should track because it shows what customers are actually buying. This metric tells you how many times each menu item is sold during a specific period, such as daily, weekly, monthly, or seasonally. Without this number, it is easy to make menu decisions based on opinion, habit, or personal preference instead of real customer behavior.
A practical way to track sales volume is to review item-level sales reports from your POS system. Look at how many units each item sells, when those sales happen, and whether demand changes by day-part, location, or ordering channel. For example, one item may sell well during dinner but perform poorly at lunch. Another may be popular for delivery but rarely ordered in the dining room. These patterns help owners understand where demand is strongest.
Sales volume also helps with better inventory and prep planning. If a certain sandwich sells 300 times per week, managers can forecast ingredient needs more accurately. If another item sells only 10 times per week, it may be creating unnecessary prep work, storage pressure, or food waste. Low sales volume does not always mean an item should be removed, but it does mean the owner should review whether that item still supports the menu strategy.
Restaurant owners should also compare sales volume over time. A sudden drop may point to pricing issues, quality problems, menu placement changes, seasonality, or customer preference shifts. A steady increase may show an opportunity to promote the item, bundle it, or feature it more prominently.
By tracking sales volume consistently, owners can see which items truly drive demand and which ones need attention. This creates a stronger foundation for pricing, purchasing, staffing, and menu engineering decisions.
Food cost percentage is one of the most important menu metrics because it shows how much of a menu item's selling price is spent on ingredients. For restaurant owners, this number helps answer a critical question - Is this item priced correctly based on what it costs to make?
The basic formula is -
Food Cost Percentage = Ingredient Cost / Menu Price x 100
For example, if a pasta dish costs $4.00 in ingredients and sells for $16.00, the food cost percentage is 25%. That means 25 cents of every dollar from that item goes toward ingredients before labor, rent, utilities, packaging, delivery fees, and other expenses are considered.
Tracking this metric at the item level is more useful than only looking at total restaurant food cost. Overall food cost may look acceptable, but individual menu items can still be hurting profitability. One item may have expensive proteins, imported ingredients, heavy portions, or high garnish costs that are not reflected in the menu price. Another item may have a strong margin because it uses affordable ingredients efficiently.
Restaurant owners should review food cost percentage whenever supplier prices change, recipes are updated, portions increase, or menu prices are adjusted. Even small cost changes can add up quickly when an item sells often. If cheese, beef, seafood, oil, or produce costs rise, the profitability of certain menu items can change almost immediately.
Food cost percentage also helps identify operational issues. If the expected food cost for an item is 28%, but actual usage suggests it is closer to 35%, the problem may be over-portioning, waste, theft, inaccurate recipes, or inconsistent prep. This is why owners should compare recipe costs, inventory usage, and POS sales together.
The aim is not to make every item have the same food cost percentage. Some popular items may justify a slightly higher food cost if they drive traffic or encourage add-on sales. The key is knowing the number so each menu item is priced, portioned, and managed with intention.
Contribution margin is one of the most useful menu metrics because it shows how much gross profit each item adds after ingredient cost is removed. While food cost percentage tells you how expensive an item is to make, contribution margin tells you how many dollars the item actually contributes to the business.
The basic formula is -
Contribution Margin = Menu Price - Ingredient Cost
For example, if a burger sells for $18.00 and costs $6.00 in ingredients, the contribution margin is $12.00. That means each burger sale contributes $12.00 before labor, rent, utilities, packaging, delivery fees, and other operating costs are considered.
This metric is important because a low food cost percentage does not always mean an item is the most profitable. For example, a side dish may have a 20% food cost and look efficient, but if it only adds $3.00 in contribution margin, it may not drive as much profit as an entree with a 35% food cost that adds $15.00 per sale. Restaurant owners need to look at both percentages and dollars to understand real menu performance.
Contribution margin also helps owners decide which items deserve better menu placement, stronger promotion, or bundling opportunities. High-margin items should be easier for guests to find and easier for staff to recommend. If an item has strong sales volume and a strong contribution margin, it is likely one of the most valuable items on the menu.
Owners should review contribution margin regularly, especially when supplier prices, portion sizes, or menu prices change. Even a small increase in ingredient cost can reduce profit when an item sells hundreds of times per week. By tracking contribution margin, restaurant owners can make smarter pricing decisions, protect profitability, and focus attention on the items that truly support the bottom line.
Menu item popularity shows how often customers choose each item compared to the rest of the menu. This metric is closely related to sales volume, but it looks at performance in context. An item may sell 100 times in a month, but that number means more when you compare it to similar items, total category sales, or overall menu sales.
For restaurant owners, popularity helps identify what guests actually value. If one appetizer accounts for a large share of starter sales, that item may be a customer favorite. If one entree consistently sells far less than others in the same category, it may need a closer review. The issue could be price, menu placement, item description, photo quality, portion size, or simply weak demand.
A practical way to track popularity is to calculate each item's share of total sales within its category. For example, if your restaurant sells 1,000 entrees in a week and one chicken dish sells 250 times, that item represents 25% of entree sales. This tells you the item is not just selling; it is taking a meaningful share of customer demand.
Popularity also affects operations. High-popularity items need reliable prep plans, accurate inventory levels, and consistent portion control. Slow-moving items need extra attention because they may create waste, use ingredients that do not move quickly, or take up valuable menu space. A low-popularity item is not always a failure, but it should have a clear reason for staying on the menu.
Restaurant owners should review popularity by time period, day-part, location, and sales channel. An item may be popular during lunch but weak at dinner. Another may perform better online than in the dining room. Tracking these patterns helps owners adjust menus, pricing, promotions, and prep levels based on real customer behavior instead of assumptions.
Once restaurant owners understand sales volume, food cost, contribution margin, and popularity, the next step is to compare those numbers together. A menu item should not be judged by one metric alone. An item can be popular but not profitable. Another item can be profitable but rarely ordered. Looking at profitability and popularity together gives owners a clearer way to decide what to promote, adjust, or remove.
A practical way to do this is to place each menu item into one of four groups -
1. High popularity, high profitability - These are your strongest menu items. They sell well and produce strong profit. Owners should protect these items by keeping quality consistent, making them easy to find on the menu, and training staff to recommend them.
2. High popularity, low profitability - These items sell often but may have weak margins. Owners should review portion sizes, ingredient costs, supplier pricing, and menu price. Even a small improvement can make a big difference because the item sells frequently.
3. Low popularity, high profitability - These items have profit potential, but customers may not notice them. Owners can improve menu placement, rewrite descriptions, add photos online, train staff to suggest them, or test limited promotions.
4. Low popularity, low profitability - These items need the most attention. If they do not support the brand, drive traffic, or serve a specific customer need, they may be candidates for removal.
This approach helps restaurant owners make menu decisions based on data instead of emotion. The goal is to understand each item's role and make intentional decisions that improve profitability, simplify operations, and strengthen the overall menu.
Menu performance is not only measured by sales, food cost, and profit margin. Restaurant owners also need to understand how each item affects daily operations. Some dishes may look profitable on paper, but they can create hidden costs through waste, prep time, storage needs, and kitchen complexity. Tracking these details helps owners see the full impact of each menu item.
1. Track waste by menu item - Waste can quietly reduce profitability. If an item uses fresh ingredients that expire quickly, owners should monitor how often those ingredients are thrown away. High waste may mean the item does not sell enough, the prep quantity is too high, or the ingredient is not used across enough menu items.
2. Review prep time and labor impact - Some menu items require more chopping, marinating, cooking, assembling, or plating than others. If an item takes too long to prepare, it can slow down the kitchen during busy periods. Owners should compare the profit from the item against the labor and time needed to produce it consistently.
3. Watch inventory movement - Ingredients should move through the restaurant at a healthy pace. If a dish depends on a special ingredient that is rarely used elsewhere, that item may create storage pressure and spoilage risk. Strong menu metrics should show whether ingredients are being used efficiently or sitting too long.
4. Compare expected usage to actual usage - If POS sales show that 100 portions should have been used, but inventory shows enough ingredients for 130 portions were used, there may be a problem. This could point to over-portioning, inconsistent recipes, employee training gaps, waste, or inaccurate inventory counts.
By tracking waste, prep, and inventory impact, restaurant owners can reduce spoilage, improve purchasing accuracy, protect margins, and run a more efficient kitchen.
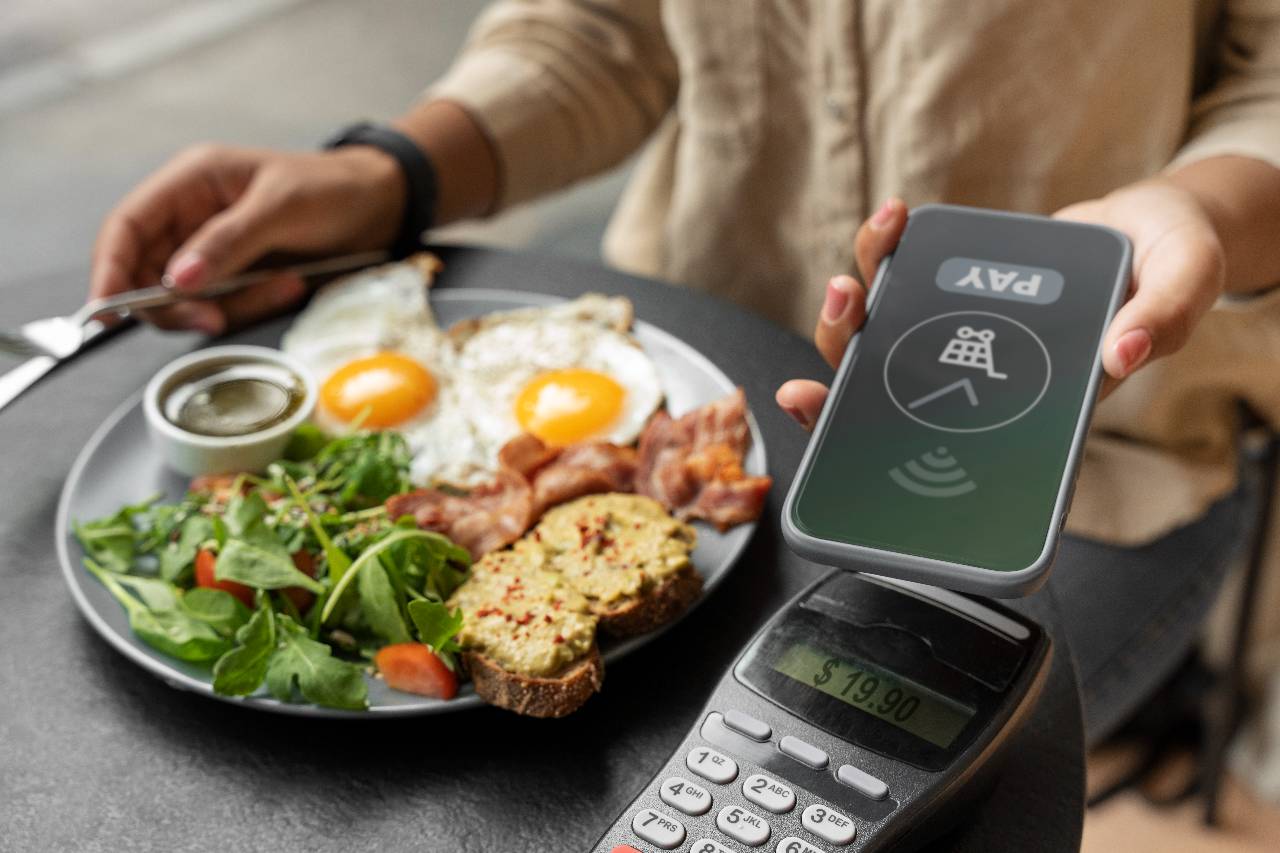
Restaurant owners should not assume that every menu item performs the same across every sales channel. A dish that works well in the dining room may not travel well for delivery. Another item may sell better online because it has a strong photo, a clear description, or easy customization options. This is why channel performance is an important menu metric to track.
1. Compare sales by channel - Review how each menu item performs across dine-in, takeout, delivery apps, online ordering, drive-thru, and catering if applicable. If an item sells heavily in-store but poorly online, the issue may be menu placement, description, photo quality, pricing, or packaging. If an item performs well on delivery apps, it may deserve stronger promotion or bundling.
2. Measure profitability by channel - An item may have different profitability depending on where it is sold. Delivery app commissions, packaging costs, discounts, and third-party fees can reduce margins. Restaurant owners should compare the true profit of an item by channel, not just the sales total.
3. Track refund and complaint patterns - Some items may generate more refunds, remakes, or guest complaints when ordered for takeout or delivery. This often happens when food does not travel well, packaging fails, or items lose quality during transit. Tracking these patterns helps owners decide whether to improve packaging, adjust the recipe, or remove the item from certain channels.
4. Review add-ons and modifiers - Online ordering often gives customers more visibility into add-ons, upgrades, sides, sauces, and modifiers. Owners should track which items drive the most upsells by channel. A menu item with strong add-on performance may be more valuable than it appears from the base price alone.
By tracking channel performance, restaurant owners can make smarter decisions about pricing, packaging, promotions, menu availability, and item placement. This helps protect profit while giving customers a better ordering experience.