How to Read a Restaurant Profit and Loss Statement
A restaurant profit and loss statement helps owners track revenue, costs, and net profit, offering insights to improve financial performance and sustainability.

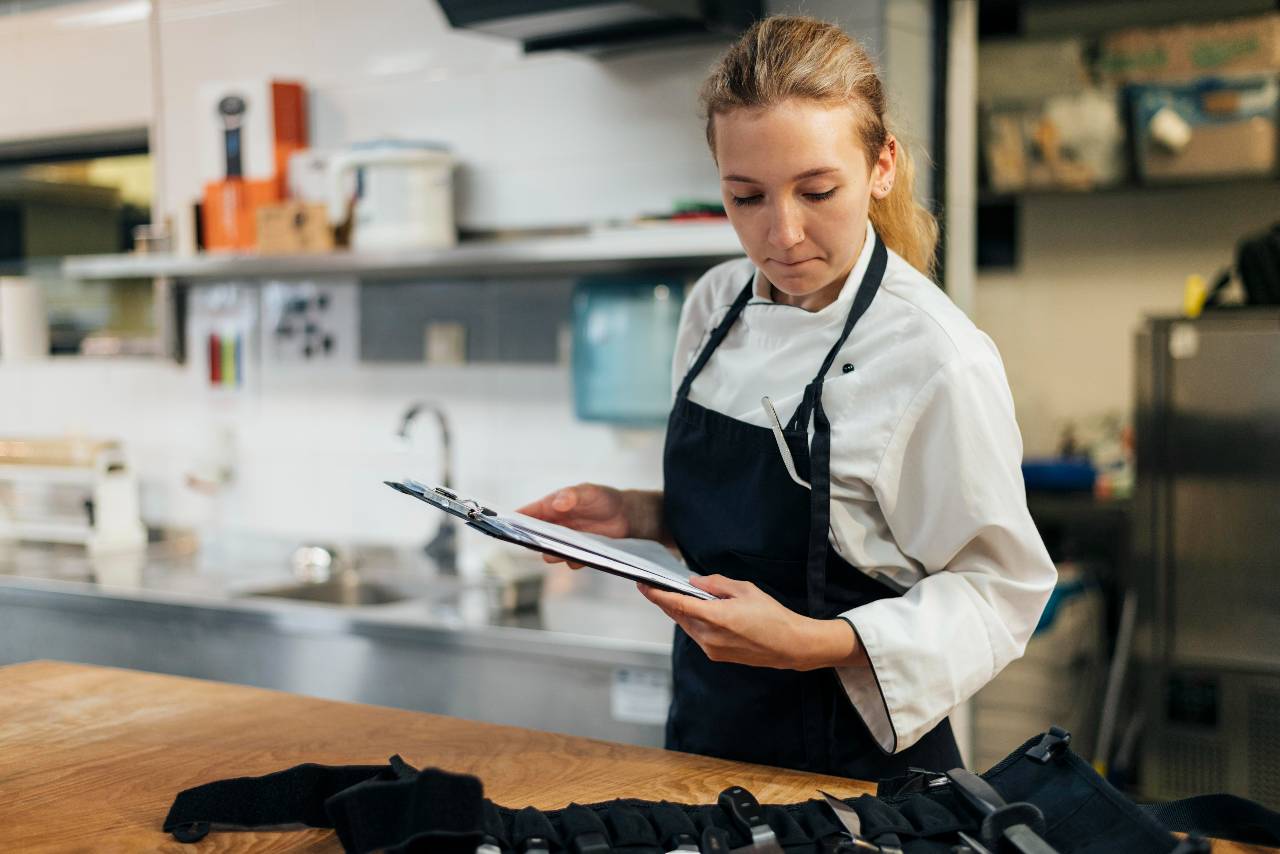
Measuring Financial Health
Operating a restaurant involves handling countless details - serving customers, managing staff, and keeping the kitchen running smoothly. But there's another part of the job that's just as important - knowing if your business is actually making money. That's where the Profit and Loss Statement (P&L) comes in.
A P&L is simply a report that shows how much money came in, how much went out, and what's left over at the end. It breaks things down into categories like sales, food costs, labor costs, and other expenses. This helps you see where your money is going and where you might need to make changes.
You might think you can keep track of this in your head, but numbers tell a different story. In fact, research shows that restaurants using monthly P&L reviews are 25% more likely to stay profitable than those that don't. By checking your P&L regularly, you can catch problems early - like food costs creeping up or labor hours going over budget.
Understanding the Structure of a P&L Statement
A Profit and Loss Statement might look like a wall of numbers, but it actually follows a simple order. Once you understand the layout, it becomes much easier to read and use.
Most restaurant P&Ls are organized into a few main sections -
1. Revenue (Sales) - This is the total money your restaurant brought in during the period, usually shown as gross sales (before any discounts) and net sales (after discounts, comps, or refunds).
2. Cost of Goods Sold (COGS) - This shows how much you spent on ingredients and beverages. It's directly tied to your menu pricing and portion control.
3. Labor Costs - Wages, benefits, and payroll taxes for all employees. This is often one of the largest expenses for a restaurant.
4. Operating Expenses - Everything else it takes to run your business, like rent, utilities, marketing, cleaning supplies, and repairs.
5. Net Profit (or Loss) - What's left after all expenses are taken out of your sales. This is your bottom line.
A P&L usually covers a set time frame - most owners look at it monthly to spot trends quickly. You'll often see numbers alongside percentages. Those percentages matter because they show each expense in relation to total sales. For example, if food costs are 32% of sales and your goal is 28%, you know you need to make adjustments.
By seeing the P&L as a simple money in, money out story, you can use it as a real tool.
Revenue - Breaking Down Your Income Sources
Revenue is the lifeblood of your restaurant. It's the total money you earn from selling food, drinks, and other services. In your P&L, revenue usually appears at the very top, because it's the starting point for everything else.
You'll often see gross sales and net sales listed separately -
1. Gross Sales - The total before any discounts, coupons, or refunds.
2. Net Sales - The amount after subtracting discounts, comps, and refunds. This is the real number you're working with.
Breaking down your revenue into different categories can give you valuable insights. For example -
1. Dine-in Sales - Orders served at your tables.
2. Takeout and Delivery Sales - Orders picked up or delivered.
3. Catering or Events - Larger orders for special occasions.
4. Alcohol Sales - Often a high-margin revenue source for restaurants that serve drinks.
Tracking each category separately helps you see where your strengths are and where there's room to grow. If delivery sales are growing fast, you might decide to invest more in that channel. If dine-in is slowing, you can explore promotions to bring more people through the door.
Percentages matter here too. For instance, if 70% of your sales are coming from one category, you may be overly dependent on it -which could be risky if trends change.
The more clearly you track and understand your revenue sources, the easier it is to make smart, targeted decisions that boost your overall sales.
Cost of Goods Sold (COGS)
Cost of Goods Sold, or COGS, is the total amount you spend on the food and beverages you sell. In simple terms, it's the cost of making each dish or drink that leaves your kitchen or bar. This includes everything from meat and vegetables to spices, sauces, and garnishes. If you serve drinks, it also covers liquor, beer, wine, and mixers.
COGS is important because it's directly tied to your menu pricing and profitability. If your COGS is too high, it eats into your profit, no matter how busy you are. Most restaurants aim for COGS to be between 25% and 35% of total sales, depending on their concept. For example, a fine dining restaurant might run higher food costs than a quick-service location, but both still need to watch this percentage closely.
To calculate COGS for a given period -
1. Start with your beginning inventory (what you had on hand at the start).
2. Add any purchases made during the period.
3. Subtract your ending inventory (what's left at the end).
The result is your COGS.
Keeping COGS in check means controlling waste, negotiating better prices with suppliers, and ensuring proper portion sizes. Even small changes - like adjusting portion weights or reducing spoilagecan make a big difference over time.
By reviewing COGS on your P&L every month, you'll quickly see if ingredient costs are creeping up and can take action before they hurt your bottom line.

Labor Costs
Labor costs are one of the largest expenses in any restaurant, often second only to food costs. This category covers everything you pay your staff - wages, overtime, payroll taxes, and sometimes training costs. In your P&L, labor is usually shown as both a dollar amount and a percentage of total sales.
For many restaurants, labor costs typically range from 25% to 35% of sales. The exact percentage depends on your concept. A fine dining restaurant with table service might be on the higher end, while a quick-service spot might run lower. Either way, keeping labor costs in balance is critical to staying profitable.
To find your labor cost percentage -
1. Add up all labor-related expenses for the period.
2. Divide that total by your total sales.
3. Multiply by 100 to get the percentage.
Example - If your labor costs were $15,000 and your sales were $50,000, your labor cost percentage is 30%.
Managing labor isn't just about cutting hours. It's about scheduling efficiently, cross-training staff, and avoiding over-staffing during slow times. At the same time, you can't compromise on service quality - under-staffing can hurt customer experience and repeat business.
Regularly checking your P&L for labor trends helps you spot issues early. If labor costs are creeping up while sales stay flat, it's time to adjust schedules or re-evaluate staffing needs. The goal is to create a balance where your team can deliver great service without eating away at your profits.
Operating Expenses
Operating expenses are the costs of keeping your restaurant open and running - outside of food, drinks, and labor. Think of them as the "overhead" you have to pay whether you serve 10 customers or 100. These expenses show up in your P&L and can quickly add up if you don't monitor them.
Common operating expenses include -
1. Rent or Mortgage - A fixed monthly cost that can take a big bite out of revenue.
2. Utilities - Electricity, gas, water, and sometimes internet or phone service.
3. Marketing - Social media ads, flyers, loyalty programs, or promotions.
4. Repairs and Maintenance - Fixing kitchen equipment, plumbing, or HVAC systems.
5. Cleaning and Sanitation - Supplies, laundry, and possibly third-party cleaning services.
6. Insurance - Coverage for property, liability, and workers' compensation.
Some of these costs are fixed (like rent), meaning they don't change much month to month. Others are variables (like marketing or repairs), which can go up or down depending on your activity and needs.
While you can't eliminate operating expenses, you can control some of them. For example, negotiating a better rate on trash pickup, switching to energy-efficient equipment, or reviewing your marketing budget for wasted spend can make a difference over time.
On your P&L, pay attention to each category's percentage of total sales. If overhead is eating up too much of your revenue, it can leave little room for profit - even if sales are strong.
Regularly reviewing operating expenses helps you identify waste, set realistic budgets, and protect your bottom line without cutting essentials that keep your restaurant running smoothly.
Net Profit (or Loss)
At the very end of your P&L, you'll find the most talked-about number - net profit or net loss. This is the amount of money left after you've subtracted all expenses (food, labor, operating costs, taxes, and any other costs) from your total sales. If the number is positive, you've made a profit. If it's negative, you've taken a loss.
Net profit is sometimes called "the bottom line" because it shows, in plain terms, how your restaurant is performing financially. While it's tempting to focus only on this number, it's important to remember it's the result of everything above it in the P&L. If your net profit is low - or negative - the reasons will usually be found in earlier sections, like high COGS, rising labor costs, or uncontrolled operating expenses.
Restaurants often aim for a net profit margin of 5% to 10%. This means that for every $100 in sales, $5 to $10 is actual profit. Anything below that can make it hard to reinvest in your business or handle unexpected costs.
To improve net profit, you can work on increasing sales, lowering costs, or a mix of both. Even small changes - like adjusting menu prices, reducing waste, or optimizing schedules - can boost this percentage over time.
Checking your net profit regularly keeps you grounded in reality. It's not just a number - it's a measure of whether your hard work is paying off and whether your business is financially healthy enough to grow.
Using P&L Insights to Improve Restaurant Performance
Reading your Profit and Loss Statement is just the first step. The real power comes when you use the information it provides to make smarter decisions that improve your restaurant's performance.
Start by reviewing your P&L regularly - monthly is best. This habit helps you spot changes early, like rising food costs or unexpected labor spikes, before they become big problems. It also helps you track whether changes you've made - like adjusting menu prices or shifting staff schedules - are working.
Look for "red flags" in your P&L. For example, if your food costs suddenly jump above your usual target, it might mean waste is increasing or a supplier raised prices. If labor costs rise but sales don't, it's a sign to review your scheduling or staff productivity.
On the flip side, a P&L can reveal opportunities. Maybe your delivery sales are growing faster than dine-in, so you could invest more in online ordering or promotions. Or perhaps your marketing expenses are high without a clear sales boost, indicating you should rethink your advertising strategy.
Use the percentages in your P&L as benchmarks. Compare your current numbers to your past reports and industry averages to understand if you're on track.
Finally, share your P&L insights with your team. When managers and staff understand how costs and sales impact the business, they're more likely to work together to control expenses and improve service.
By turning your P&L from just a report into a regular tool for decision-making, you take control of your restaurant's financial health - and set it up for long-term success.